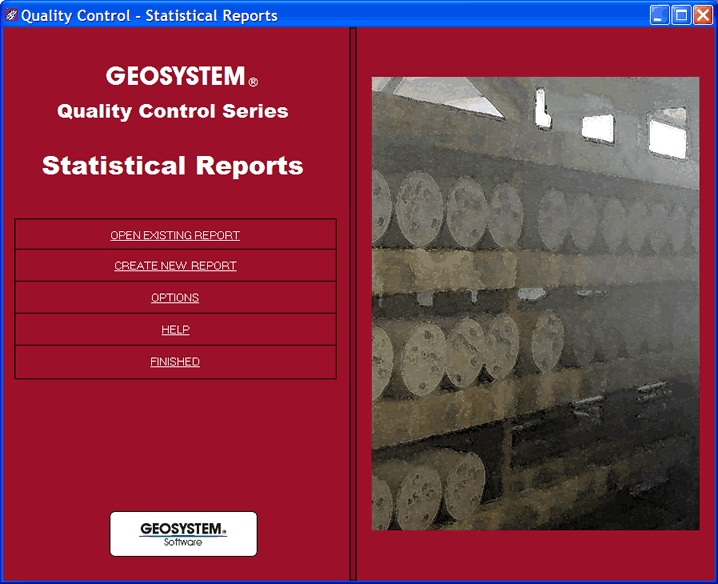
This program is a companion to our Quality Control-Concrete database software. QC-Statistics produces a complete mix performance document featuring statistical reports following ACI standards for minimum required average strength determination. Use on major projects to track mix compliance and performance and for identifying cost inefficiencies.

Mix Performance Analysis
QC-Statistics gives you a Mix Performance analysis which includes:
- The minimum required average strength per ACI 301-10 section 4.2.3.3.a
- Laboratory testing proficiency per ACI 214R
Statistics Table
QC-Statistics gives you a table of statistics which can include:
- Standard deviation
- Coefficient of variation
- Moving average test result - applicable to ACI 318 section 5.6.3.3
- Moving average standard deviation - provides insight into batching and mixing variations
- Moving average coefficient of variation - also provides insight into batching and mixing variations
- Range of test and moving average range of test - applicable to ACI 214 section 5.5.3
- Within-test coefficient of variation - applicable to ACI 214 section 3.4, concrete control ratings
- Non-statistical items reported can include specimen strengths, test result, slump, air, and temperature
- 2 age groups can be optionally analyzed at the same time - typically 7 and 28 day
Charts
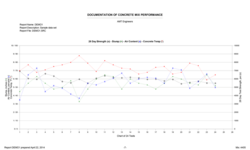
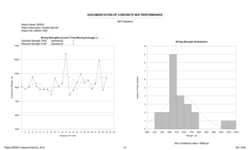
QC-Statistics reports can include the following charts:
- Individual and moving average of strength
- Moving average of standard deviation
- Moving average of range of test
- Strength distribution and distribution curve
Form Designer
QC-Statistics form designer will create forms to accomodate the typical needs of statistics users. Some of the report elements which are configureable using the form designer are:
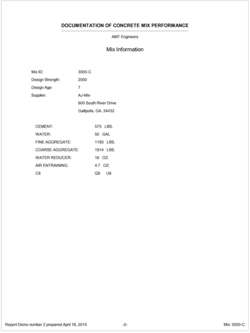
- Which pages (Project, Mix, Tables, Analysis and Charts) are to be included
- Portrait or Landscape orientation
- Where to place the date (or omit)
- Where to place the mix list (or omit)
- Page border on or off
- Layout of the Project page
- Layout of the Mix page
- Test results to be included in the Statistics Table
- Titles for and width of the columns in the Statistics Table
- Statistical results to be included in the Statistics Table
- Number of tests to be used as the span in moving averages
- Choice to analyze 1 or 2 ages of specimens
- Nearly all items on the Analysis Summary are optional
- Nearly all titles on the Analysis Summary are user configurable
- Use General Construction or Laboratory Trial for the ACI 214 class of operation
- Show or omit Additional Qualifying Mixes
- Number of tests to show on the Strength Chart
- Option to include or omit the Moving Average on the Strength Chart
- Minimum bracket width on the Strength Distribution Chart
- Option to include or omit the normal curve on the Strength Distribution Chart
- Option to include or omit the confidence value on the Strength Distribution Chart
- Option to pick the Confidence Value Percentage on the Strength Distribution Chart
- Setting for the First Bracket Offset on the Strength Distribution Chart
- Option to include or omit the ACI 214 ratings on the Standard Deviation Chart
- Setting to select the number of tests reported on the Standard Deviation Chart
- Option to include or omit the ACI 214 ratings on the Range of Test Chart
- Setting to select the number of tests reported on the Range of Test Chart
- Option to plot the cumulative average or moving average on the Range of Test Chart
- Pick combinations of Slump, Air Content, and Temperature to be shown on the Field Test Correlation to Strength Chart
- Setting to select the number of tests reported on the Field Test Correlation to Strength Chart
Report Samples
Shown here are each page of the program's 4 basic report formats. Click on any thumbnail for a larger view.
Example report using standard letter size paper and portrait orientation
(click here for a PDF file of this report)
Example report using standard letter size paper and landscape orientation
(click here for a PDF file of this report)
Example report using legal size paper and portrait orientation
(click here for a PDF file of this report)
Example report using legal size paper and landscape orientation
28 and 56 day analysis
(click here for a PDF file of this report)


