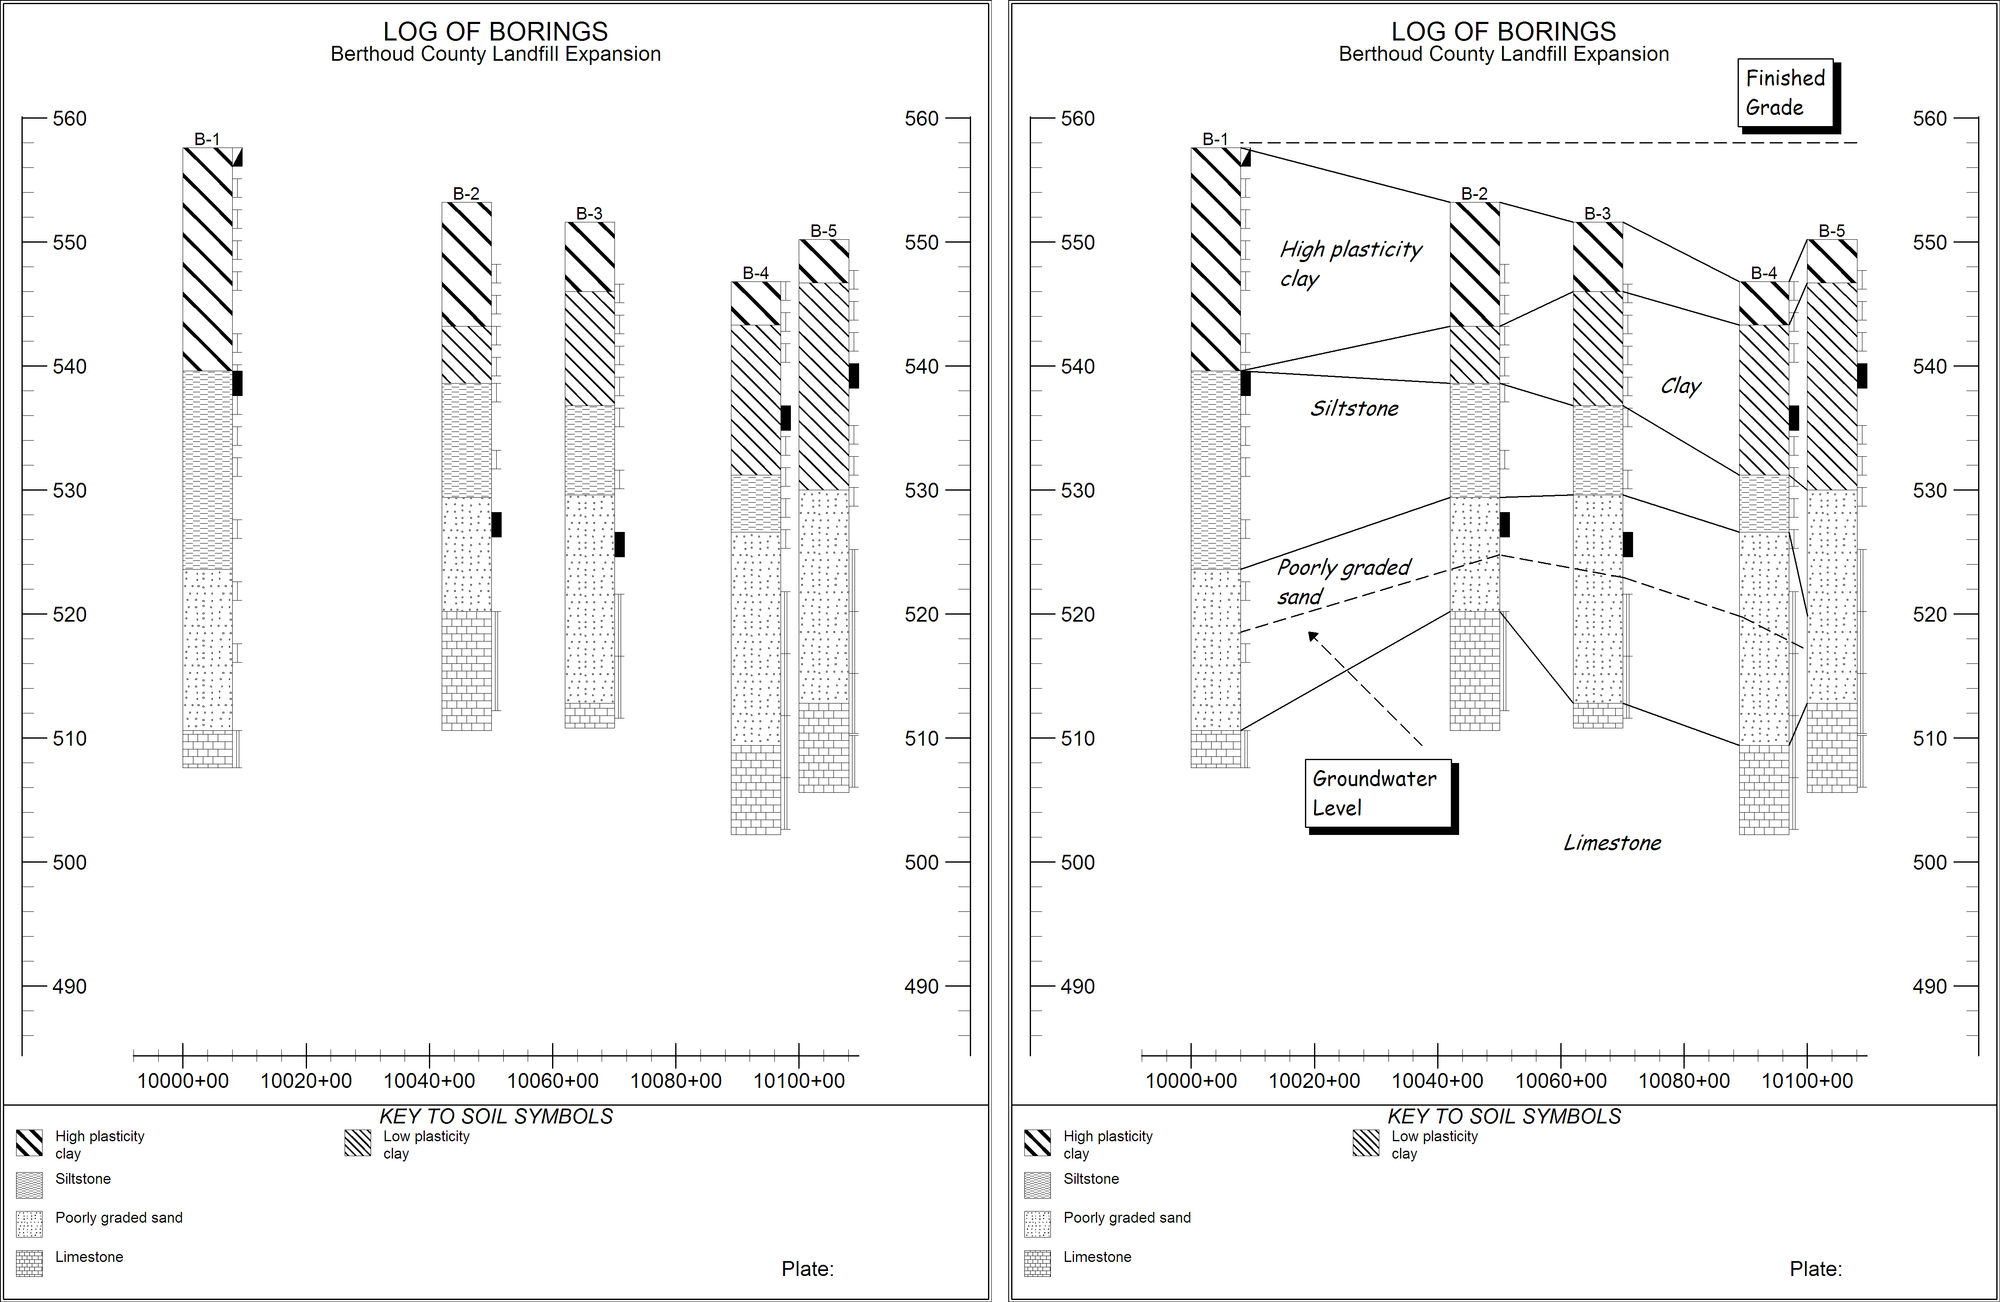
LOGDRAFT's profile forms can be set up to automatically display information concerning the conditions encountered at borings around a site -- this information is usually in the form of a graphic key to the strata layers encountered along with symbols indicating groundwater depths and possibly testing information such as the natural water content of samples recovered from the hole. However, it isn't possible to automatically add information about conditions between borings (for example, there isn't any way to have the program automatically plot the location of an underground storage tank); to compensate for this, LOGDRAFT features a facility for adding annotations to a profile report after it's been plotted on-screen. This allows you to draw and label the strata layers, show how the finished grade will appear relative to the original ground level and show the location and type of any underground structures.

Original and Annotated Profiles
- LOGDRAFT only supports annotating profile and plan reports. Boring logs and summaries can not be annotated. If you'd like to annotate a boring log or summary, consider exporting the report in an .EMF format (as described in this section) then import the .EMF file as a picture into a drawing program such as Inkscape (http://www.inkscape.org/).
- When they are added, annotations are associated with a given elevation and plan coordinate and become a permanent part of the project. Any future profile report that includes the elevation and plan coordinate given to an annotation will show that annotation.
To add annotations to a profile report, follow the steps discussed in this section to preview the profile on-screen. Pick any profile form -- remember that once an annotation is added to the project, it will show up on any profile report that shows the appropriate section of the project, regardless of the form used. Once the report has been drawn on-screen the menu bar at the top of the screen should include a new menu selection titled Annotate.
Reminder: Annotations are given elevation and plan coordinates when you place them onto a profile. If you change the horizontal or vertical scale of the report the annotation will appear to have moved because the coordinate associated with the annotation will appear in a different place on the report.
- When annotating a profile, remember that you can save the borings you've selected for a given profile as a cutline, which means that you can instantly re-select the same set of borings when you're ready to print the profile or add other annotations. See this section for further details.
- Because the whole idea behind the annotation facility is to allow the user to note the conditions that exist between borings, if you want to annotate a report, do not choose the No horizontal scaling option discussed in this section. When No horizontal scaling is selected the program spaces borings at even intervals across the page, which means that the gaps between the borings really don't correspond to any actual subsurface section.
(If you need to annotate a profile produced for a project that doesn't have boring location information, refer to this section.)
If you would like to add annotations to a profile but don't have prompts on your data entry screen to enter your borings' coordinates, this section provides step-by-step instructions on adding these prompts.
Further information: